CBC utilities
CBC utilities
Once responses to your CBC exercise are collected, preference scores (utilities) are estimated using Hierarchical Bayesian (HB) utility estimation. These scores represent the relative desirability of each attribute level; higher scores indicate greater preference.
Interpreting attribute utilities

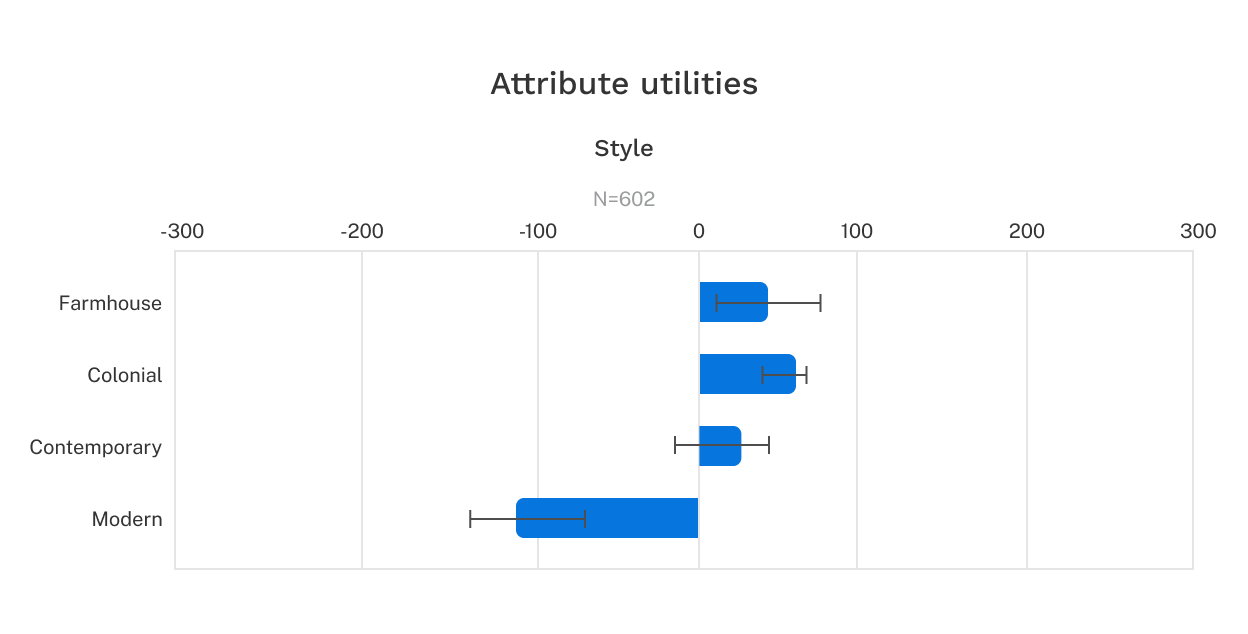
Each attribute is displayed on its own chart or table, showing utilities for each level. In Discover, utilities are zero-centered — within each attribute, scores sum to 0.
Utilities should only be compared within the same attribute, never between different attributes. Since utilities are additive across attributes, the total utility of a product alternative is the sum of utilities for its attribute levels, with one level chosen from each attribute.
Due to zero-centering, even if all levels within an attribute are considered excellent, some will be positive and others negative. A negative score does not mean respondents dislike a level, it means they prefer it less than other levels within that attribute. The inverse also applies: a positive score doesn't necessarily mean respondents like a level in absolute terms, only that they prefer it relative to other levels in the same attribute.
Example
Consider these three levels and their zero-centered utilities:
Everybody likes winning money, so all three amounts would be welcome. But $300,000 is preferred to $200,000, which is preferred to $100,000. Since utilities must sum to 0, the least desirable level receives a negative score, but that doesn't mean respondents wouldn't want to win $100,000.
Zero-centered diffs scaling
Raw utilities are multiplied by a constant so that the range of utilities for each attribute averages 100 across all respondents. This ensures each respondent carries nearly equal weight when computing average utilities across the sample.
If you export data to build your own market simulator in Excel, use the raw utilities rather than zero-centered diffs to ensure the market simulator math is accurate.
Relative attribute importance
Below the attribute level utilities, the relative attribute importance report shows how much each attribute impacts choice. Importances sum to 100 and are calculated at the individual level, with displayed values representing the sample average.
Interpret importance scores with caution. They are directly tied to the range of levels included in your study. For example, a price attribute ranging from $100 to $200 will appear less important than one ranging from $100 to $300. Similarly, a study with 6 attributes will show importances roughly half the size of a 3-attribute study, since all importances sum to 100.

Confidence intervals
You can optionally display 95% confidence intervals alongside utility scores. Assuming your respondents are representative of the population, you can be 95% confident that the true population utilities fall within this interval.
Confidence intervals can also help assess whether one level is preferred to another within the same attribute. If intervals for two levels don't overlap, you can be at least 95% confident one is preferred to the other. As with utilities, do not compare levels between different attributes.
Segmenting
Segmenting splits exercise results into groups based on responses or values from a question or variable in your survey. For example, segmenting by respondent location to compare North America versus Europe. Respondents without a value for the selected variable are excluded from the results.

Downloads
The download menu in the upper right corner of the settings panel offers five files.
Scores
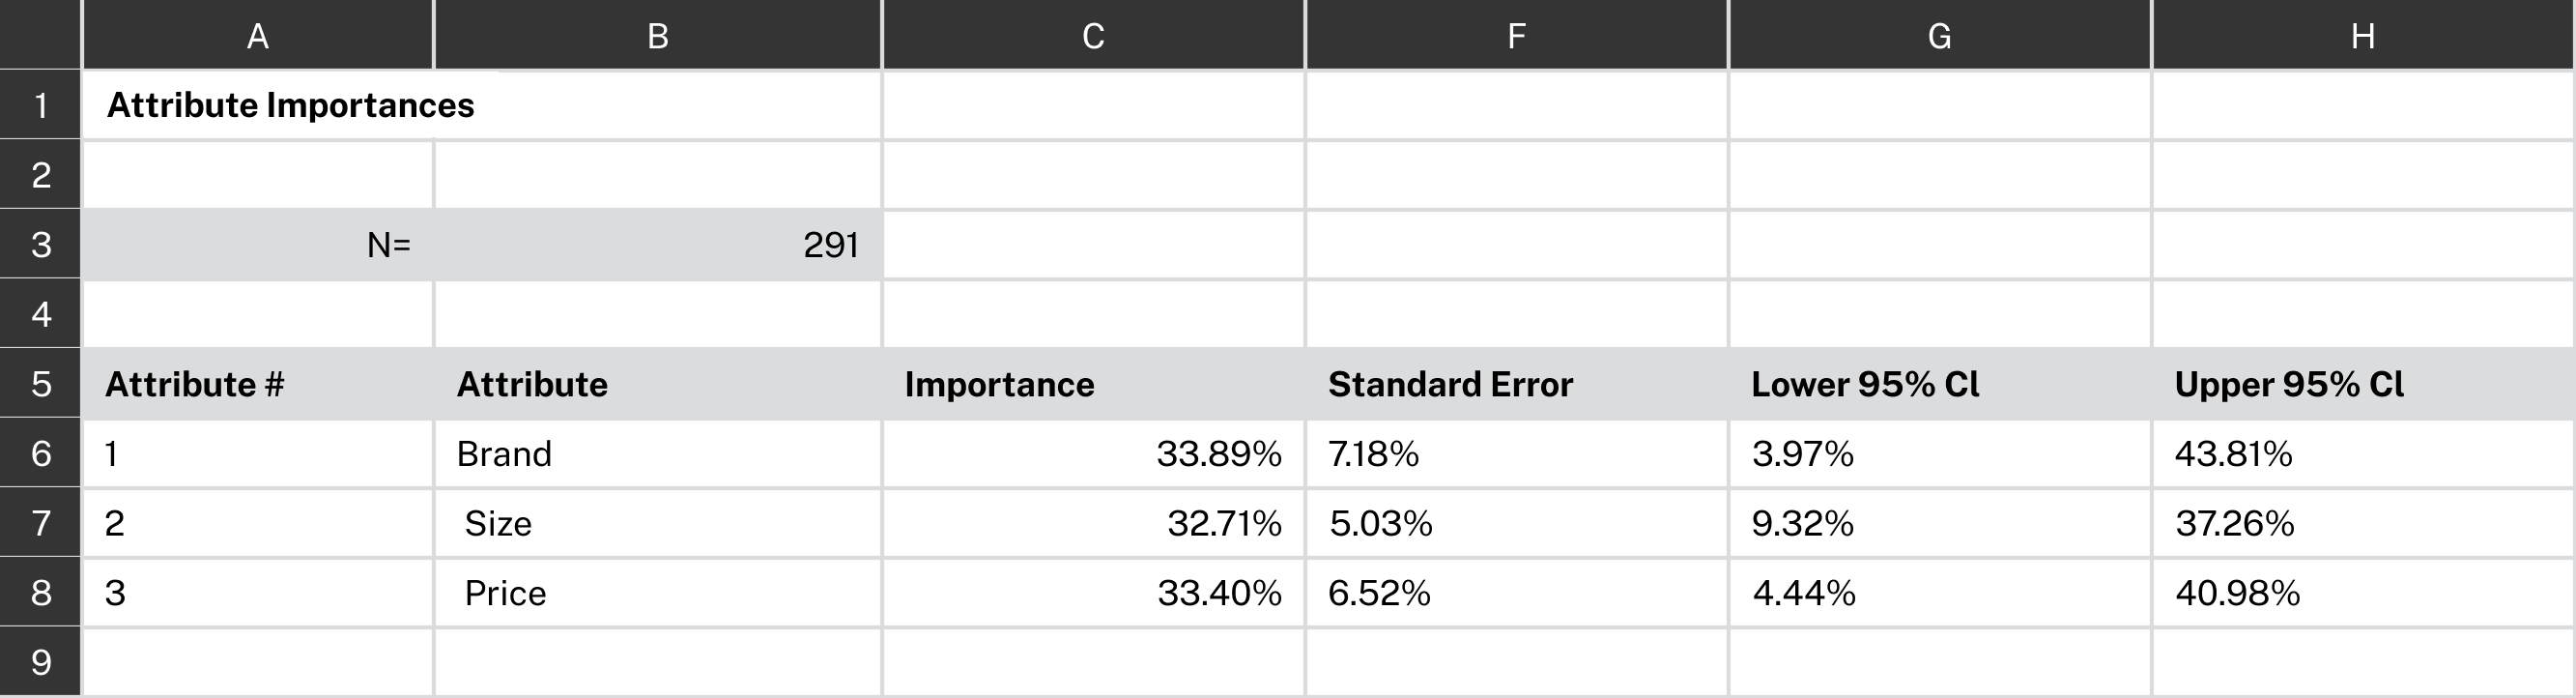
An Excel summary of CBC attribute utility scores and importance scores, identical to the tables viewable in Discover. Scores are rescaled.

Charts
A zip file of PNG images for each attribute level utility chart and the relative attribute importance chart.
Design & choices
A table of the exercise design each respondent saw and which concept they chose for each task. If the dual-response “none” option is used, this file includes separate design and choices tabs for compatibility with Sawtooth's desktop software.

Individual scores
Individual utility scores can be downloaded in two formats:
- Rescaled: A table of each respondent's zero-centered diffs utilities for each attribute. Includes a fit statistic column labeled [CBCName]_Fit (RLH). This root likelihood statistic describes the probability that a respondent would have made the selections they did, given their utility scores — or more precisely, the geometric mean of the probabilities that the raw utilities can explain the respondent's choices.
- Raw: A table of each respondent's raw HB utilities for each attribute, prior to rescaling. Use these if you plan to build your own market simulator in Excel.
Heading 1

Heading 2
Heading 3
Heading 4
Heading 5
Heading 6
Lorem ipsum dolor sit amet, consectetur adipiscing elit, sed do eiusmod tempor incididunt ut labore et dolore magna aliqua. Ut enim ad minim veniam, quis nostrud exercitation ullamco laboris nisi ut aliquip ex ea commodo consequat. Duis aute irure dolor in reprehenderit in voluptate velit esse cillum dolore eu fugiat nulla pariatur.
Block quote
Ordered list
- Item 1
- Item 2
- Item 3
Unordered list
- Item A
- Item B
- Item C
Bold text
Emphasis
Superscript
Subscript